Welcome to the AGRIS tutorial on the ATCISDB
The following tutorial was
developed to help guide a new user through conducting a search through the
ATCISDB and provides information on using the website as a whole.
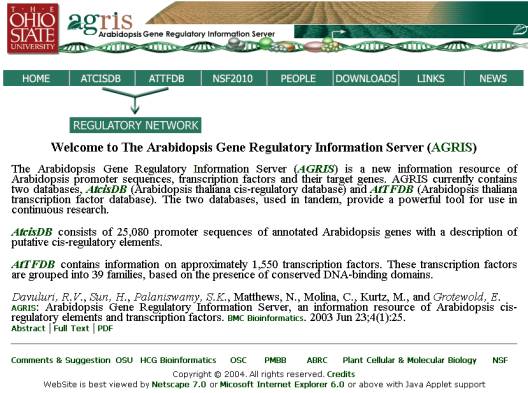
AGRIS
Homepage-
The header contains links to
“HOME” the homepage, the “ATCISDB” a cis-regulatory database consisting of the
5' regulatory sequences of all 25,080 annotated genes with a description of the corresponding
cis-regulatory elements. The “ATTFDB” a database of information on almost 1,550
transcription factors
(TF) arranged into 39 families. “NSF2010” will provide information about the NSF
information of Arabidopsis 2010 project, “DOWNLOADS” will provide information
about the data download information for AtcisDB and AtTFDB, “PEOPLE” will provide
information about the individuals that have currently contributed to the
website, “LINKS” contains links to additional Arabidopsis resources, “NEWS”
will provide information about recent updates and events. In addition, there
are links to various departments at The Ohio State University that have
contributed to the project.
Search the ATCISDB
Click on the ATCISDB link
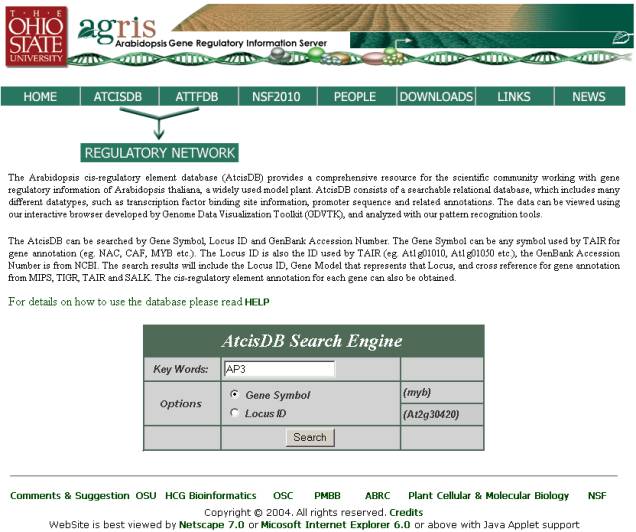
ATCISDB Homepage-
On the ATCISDB homepage, type in a . . .
Gene Symbol: the common gene name
Locus ID: a unique locus name that corresponds to a
transcribed region in the Arabidopsis genome. The names were designated as part
of the genome sequence annotation and are associated with genes, genetic
markers, polymorphic states, or map features. The format of the
LocusID is, AtXgYYYYY.
The “At” refers to Arabidopsis thaliana, the “X” number corresponds to the
chromosome number, the “g” refers to gene and the 5 following “Y”s correspond
to the five-digit code, numbered from top to bottom of the chromosome.
Then select the corresponding radio
button and click Search.
Search Results
Page-
Search Results are displayed on the
“Search Results” page, each page lists up to 10 records, to view additional
records click the “First”, “Next”, “Previous”, or “Last” links. After finding
the gene you were looking for you may view a variety of information.
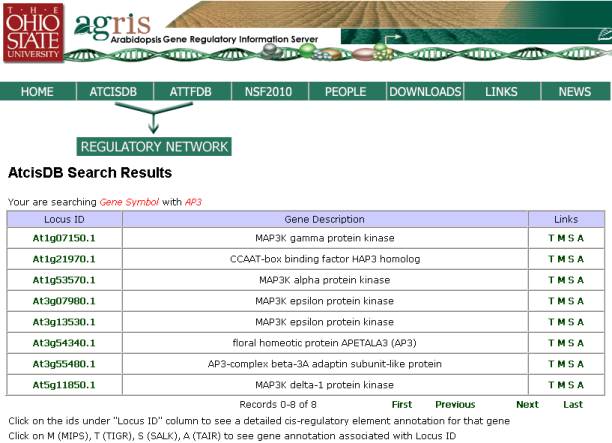
Locus ID: by selecting on the locus ID you may
view the cis-regulatory elements mapped to the chromosome and a description of
each binding site (additional detail in the next section of the tutorial Binding Site Page)
Links: you can view additional information from various
Arabidopsis resources TIGR,
MIPS, SALK, and TAIR.
For example, if a search was conducted
using MYB15, the following pages would be displayed utilizing the various link.
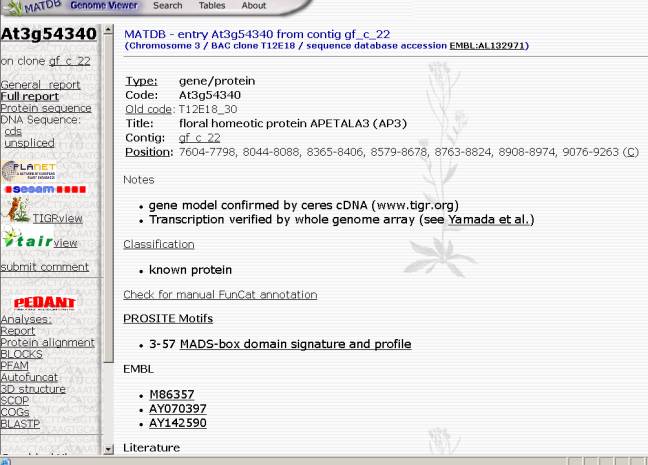
(M) for MIPS (Munich Institute for
Protein Sequences): the MATDB within the
MIPS website contains all Arabidopsis
sequences and annotations produced by the
Arabidopsis Genome Initiative plus
mitochondrial and chloroplast genomes.
Sequences were consolidated from European
sequencing projects, Cold Spring
Harbor Lab, and Washington University.
Information obtained from MIPS website includes name, title, function, PROSITE
motifs, and Arabidopsis ESTs (as seen in figure below).
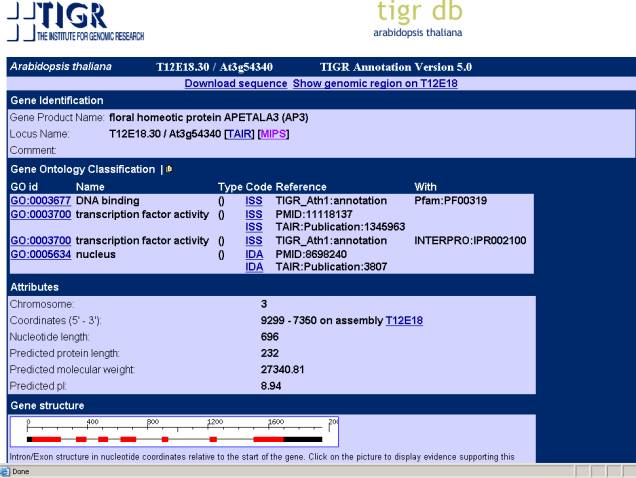
(T) for TIGR (The Institute for Genomic
Research): An alternative DB of
Arabidopsis sequences and annotations
from all AGI labs. The user can view various information about the gene searched
on, including Gene Product and Locus name, attributes, gene structure and
function (as seen in following figure).
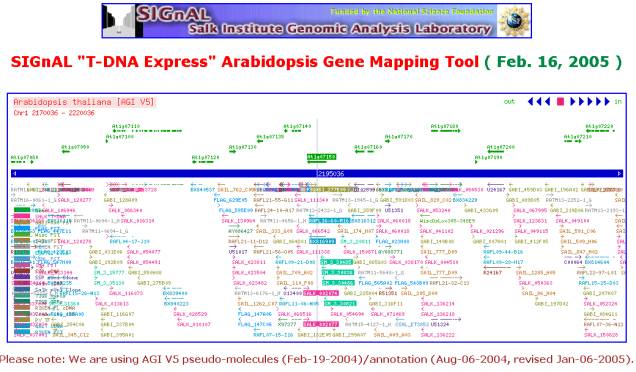
(S) for SALK: Utilizing the SIGnAL
Arabidopsis Gene Mapping Tool, it provides a map of the genome area in which
the locus is found. On the map, cDNA (full-length cloned copies of mRNA) and
T-DNA (sites of insertion of Agrobacterium T-DNA in the Arabidopsis genome)
information is displayed in relation to the LocusID entered (as seen in figure
below).
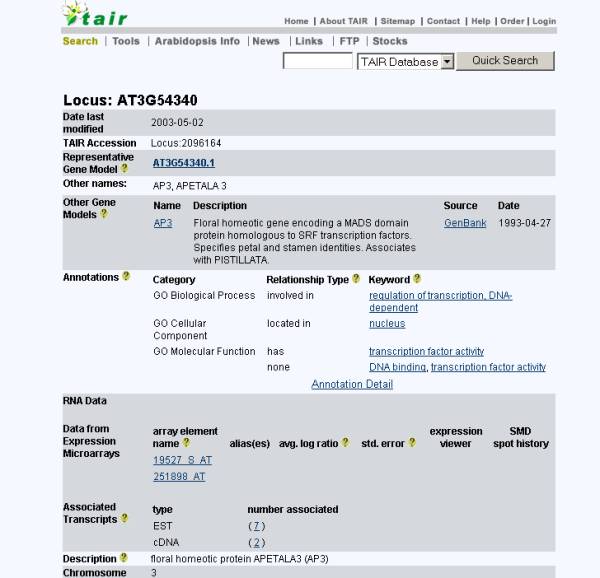
(T) for TAIR (The Arabidopsis Information
Resource): A genomic data resource collected from a wide variety of sources,
with information about genes, markers, polymorphisms, maps, sequences, clones,
DNA and seed stocks, gene families and proteins. A link to the TAIR database
contains information on TAIR accession number, gene model, description,
nucleotide sequence, protein data, and map locations.
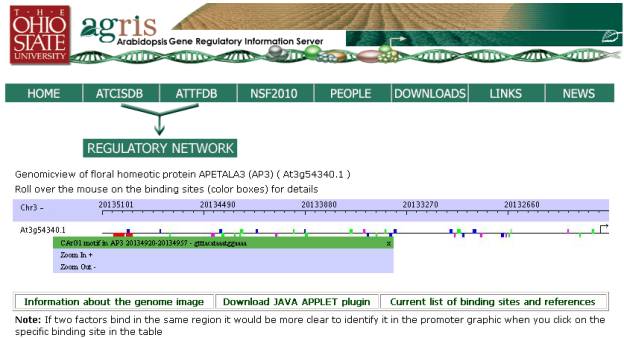
Binding Site Page-
If the user clicks on the LocusID from
the search page, he/she will be directed to the binding site page, which shows
a graphical representation of the Locus with the predicted binding sites, a
table with promoter information, and a table listing each of the binding sites
with additional information.
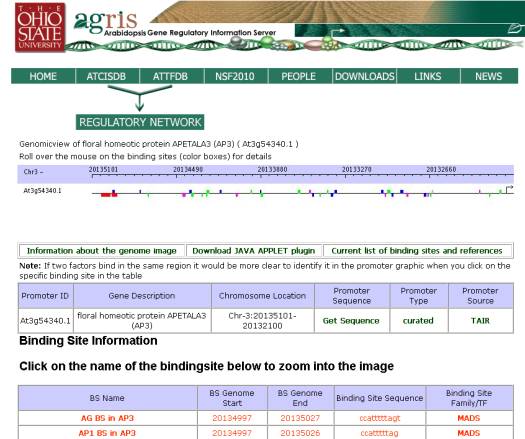
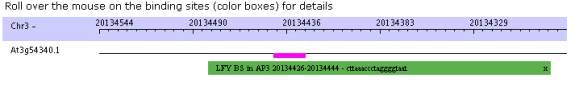
Binding Sites Map: The user may slide
his/her cursor across the binding sites to see the detail (site name with
beginning and ending sites, and the sequence identified) and zoom in or out of
the promoter sequence. Zooming in and out will open a new browser and display
the new promoter image. Please note if 2 or more transcription factors bind to
the same promoter sequence both will not be represented on the image, but both
will be listed in the table.
Each box type on the graph is a different
color –
1. Blue – promoter motif
2. Red – documented binding sites in a
specific promoter
3. Purple – specific binding sites that
are found in promoters other than the specific
documented promoter
4. Green – binding sites for a specific
transcription factor or transcription factor family
Boxes above the line indicate binding
sites in the “+” strand and boxes below the line are binding
sites in the “-“ strand.
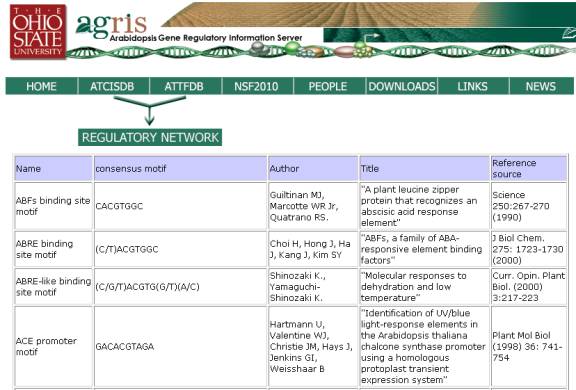
The most current list of specific binding
sites can be viewed by clicking the “Click here to view the most current list
of binding sites and references” link. These are the binding sites that have
been documented in various scientific journals and are designated as red on the
image.
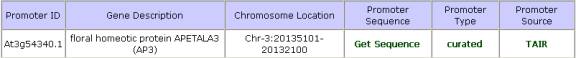
Promoter Table: In addition to viewing specific binding
sites we have included promoter
information. Information includes the
promoter Locus ID, description, chromosome location, sequence, and AGRIS type.
There are two types of promoters in AtcisDB. Predicted promoters and curated
promoters. Predicted promoter sequences were determined by downloading the
annotated coding sequences and the chromosomal sequences from TIGR. The coding
sequences were mapped to the chromosomal sequences using BLAT. The intergenic
region was considered to be the promoter of the next downstream gene, to
exclude any coding region of upstream genes. The curated promoters were found
by matching 13,181 Full length Arabidopsis cDNAs
from the Riken institute with the
predicted promoters from AGRIS. The promoter sequence can be seen by click on
the “Get Sequence” link under promoter sequence.
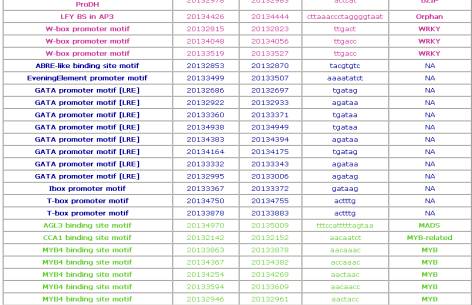
Binding Site Information Table: The user may scroll through the binding
sites displayed to find the site of interest to see the gene description and
view the promoter sequence by clicking on the “Promoter Sequence” link.
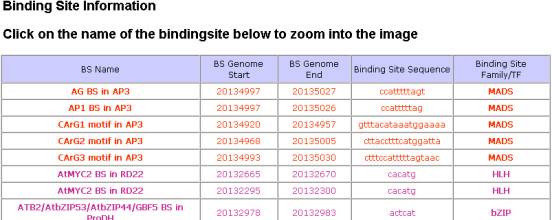
Clicking on the BS name will display the
BS on the promoter and binding site information.
BS Genome State and End give the location
in the promoter where the motif begins and ends. The sequence shows the user
the specific motif found in the promoter. For those binding sites that are
associated with a particular TF or TF family, additional information can be
obtained by click on the TF family link in the “Binding Site Family/TF” column.